Product Hunt Analysis: Categories! Contributors!
July 3, 2014
There have been a couple of Product Hunt data projects floating around the internet lately. Leo’s analysis looked at trends in product names and taglines. Mattermark’s analysis looked at the correlation between Product Hunt and fundraising. And Artiom’s project visualized metrics around products and contributors.
I wanted to look at who was posting and what they were posting. There was just one problem: there are no tags for products posted to Product Hunt.
According to Mattermark, over a third of products on Product Hunt aren’t listed on places like Crunchbase or AngelList (and that’s after cleaning the data to only look at startups), so tapping into other APIs was out.
I could have outsourced the task to a VA, but after tagging a few to test out my methodology, I realized picking just one category per product was more art than science, and I didn’t feel comfortable outsourcing.
So, I did it myself. I tagged 1,023 products on Product Hunt, posted between 5/14 and 6/18 this year. (I only looked at products in this date range because of a 5/13 algorithm change that compensated for time-of-day affecting upvotes). With that data in hand, here’s a look at the categories and contributors of Product Hunt.
(Don’t want to read the whole post? See the tl;dr of observations at the bottom.)
Who’s Posting, and Does It Matter?
Firstly, I wanted to get a better sense of Product Hunt’s contributors. Only 1-2% of Product Hunt’s 25K+ members can post. I looked at: A) who was posting and how often, and B) whether a contributor’s reputation correlated to a product’s popularity on the site.
In my sample of 1,023 products, there were 345 contributors. I don’t know the exact number of total contributors out there, but assuming it’s between 250-500, this probably represents most of them.
Just over half (55%) only posted a product once during this period. The top 10% most frequent contributors (34 people total) had posted 6 or more hunts, but they had a decent spread. Jack Smith, the #1 contributor, posted 62 products in this period. Geoffrey Weg, at #2, posted 36.
The top 10% most frequent contributors posted just under half (48%) of all products, which actually makes for a pretty good spread among all contributors, if you consider the 1% community rule.
I also pulled everyone’s gender (via Twitter) out of curiosity. 91% of contributors are male; just 9% are female. I was a little surprised at the disparity. I’m curious to know how the gender of contributors compares to the gender of the Product Hunt community at large.
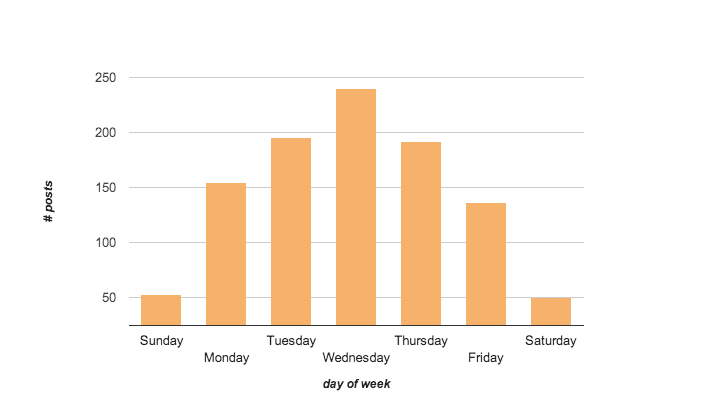
Wednesday is the most popular day to post, followed by Tuesday and Thursday.
I didn’t find any correlation between a contributor’s internal reputation (measured by frequency of posts) and a product’s upvotes or comments. The products with the most votes and comments came from contributors who had only posted once or twice. I also didn’t find any correlation between a contributor’s external reputation (measured by number of Twitter followers) and the popularity of the products they posted.
In other words, it’s possible to post something just once that turns out to be popular. How well the product is received probably has more to do with the product itself.
Leo has already covered commonalities among popular products’ names and taglines, so let’s take a look at product types.
What Types of Products Do People Post?
I broke up the products into 76 categories, using AngelList’s market tags as a gut check. Here are the most frequently-hunted product categories:
- Developer Tools
- Design
- Product Updates
- Hardware
- Food and Beverage
- Music
- Sales and Marketing
- Photography
- Utilities
- Entertainment (note: this means “primarily for entertainment purposes”, not “entertainment industry”)
- Sports (skewed by the times - over half of these had to do with the World Cup. Fun fact: golf is popular among product hunters!)
- Personal Productivity
The top 12 categories made up just over one-third (35%) of all products posted during this period.
I’ll refrain from posting the entire list of categories here, but these categories also deserve a shout-out:
- Kids (#14). There are quite a few posted products geared toward kids and/or parents.
- Collaboration (#17). Products that help teams collaborate better (mostly project management software). Originally tagged as SaaS, but there were so many that they became their own category.
- Analytics (#13) and Data (#16). Includes data visualization. The popularity of these categories might speak to the hacker nature of the Product Hunt community (more on that in a bit).
- Social Media (#15) and Messaging (#20).
- Health and Wellness (#18). I was surprised this wasn’t higher, actually, considering Food and Beverage is at #5.
And here are a couple on the bottom of the list that might surprise you:
- Advertising (#68). There are a lot of advertising companies out there, but they’re not commonly found on Product Hunt.
- Reviews & Recommendations (#76). This one bottomed out the list.
Which Categories Are Most Likely to Get Upvoted?
The categories above represent the types of products that are most likely to get posted to Product Hunt. But which types of products are getting votes?
I wanted to correlate the two, but the number of products per category varies so widely that I couldn’t do it without invoking the wrath of the Statistics Gods. For example, Q&A has the most votes, but there are only 4 products in that category, whereas Developer Tools has 55 products in its category. It doesn’t make sense to compare them.
So instead, let’s just look at the variance between votes and comments in the top 12 categories above.
Among these categories, the highest median of upvotes went to Product Updates (19), Personal Productivity (17), and Photography (15). By comparison, the median of the overall sample was 11 votes. Not much can be said about the remaining categories with statistical confidence, but these three are markedly higher than the rest. (Notice that Personal Productivity ranks #12 on the list of most-frequently posted categories, but is the second-most upvoted category.)
Sales and Marketing ranks the lowest of the top 12, with a median of 9 votes. While I can’t say with strong confidence that this is definitely the least-popular category, it is certainly markedly lower than the top ones. I have two theories around why this might be the case: 1) This is the wrong crowd for sales products, if it’s more of a hacker-focused community, and 2) Not all, but some of the sales-related products come off as aggressively sales-y or off-brand, which might turn people off from checking them out.
As for which categories had the highest number of comments, there wasn’t enough variance to draw conclusions with statistical confidence, with the exception of Personal Productivity, which had a median of 6 comments. By comparison, the median of the overall sample was 2 comments.
As you can see, there’s not much that can be said about correlating votes or comments to product types, because there just isn’t enough data on Product Hunt yet. In that sense, I echo Leo’s comment that, “This was fun to do with a dataset of 3000 products, but what really excites me is the dataset that Product Hunt will have in a year or two.”
So let’s dig in to the stuff we can talk about, because I think the top 12 categories are very telling of the kind of place Product Hunt is.
How Does Product Hunt Compare to the Startup Community At Large?
As one might expect, many of the top categories on Product Hunt are very consumer-focused (Hardware - which often translates into retail; Food and Beverage; Music; Photography). Outside of these areas, I see a couple of other buckets here.
Stuff that’s useful for work. The Developer Tools, Design, and Sales and Marketing categories certainly fit into this area. Examples include Card and The Noun Project.
I was initially surprised to see how many design- and developer-related products were posted because I figured most products would have a consumer bent. But it makes sense if many contributors to Product Hunt are hackers or designers (which I suspect they are)…so they post things that they found useful themselves.
Updates to existing products. The #3 most-popular category was product updates - for example, Apple’s iOS8 or Amazon’s new Prime Music. I didn’t expect to see so many product updates posted to Product Hunt, which suggests the community has a secondary function: not just a place to discover new products, but also to discover the latest updates to existing products.
(Side note: It was tough to distinguish what counted as a product update. For example, Amazon’s new music service is technically a standalone product, but it comes from a huge company that’s primarily known for something else.)
Stuff that’s personally useful or entertaining. The #9 and #10 most popular categories were Utilities and Entertainment, and Personal Productivity took the #12 spot (which really should have been #11 - see note about Sports above). Examples include Stache, SHRTURL, and Assistant.To.
Like the “useful for work” bucket, it makes sense that many of the products posted to Product Hunt are immediately useful and actionable. A new community product might be interesting, but signing up and testing it out is less gratifying than installing a Chrome plugin that instantly replaces your new tabs with a beautiful photo. The excitement of discovering quick-fix products (whether for personal or work use) that make life better is, I imagine, what keeps many Product Hunters coming back.
There’s also something else to be learned about the popularity of this category grouping. Much has been made of the fact that many products on Product Hunt were not already listed on AngelList, CrunchBase, Mattermark, or other popular startup databases. However, unlike those other places, not everything posted to Product Hunt is meant to be a startup.
I doubt the creators of @pmarca-tweet-essays or Emoji Zone are trying to raise a $1M seed round for their ideas. They’re just fun, quirky, wonderful places on the internet. There is joy to be found in opening up Product Hunt and finding yourself unexpectedly wandering through the solar system or experiencing a light year. While these products don’t make up the majority of what’s posted to Product Hunt, you’ll never find them on AngelList or Mattermark.
Product Hunt overlaps with the world of startup databases and sourcing tools in a big way, but we shouldn’t forget that at its core, it’s a place for product lovers: for people to share the things they discovered that helped them out at work today, made their lives a little more efficient, or just made them smile.
tl;dr
- A contributor’s internal (measured by frequency of posting) and external (measured by # Twitter followers) reputation doesn’t correlate to how well the product does on Product Hunt.
- 91% of people who post products are male, 9% are female.
- Wednesday is the most popular day to post, followed by Tuesday and Thursday.
- Top Product Hunt categories fall into these buckets:
- Consumer-focused (Hardware - #4, Food and Beverage - #5, Music - #6, Photography - #8)
- Useful for work (Developer Tools - #1, Design - #2, Sales and Marketing - #7)
- Personally useful or entertaining (Utilities - #9, Entertainment - #10, Personal Productivity #12)
- Updates to existing products (#3)
Not everything posted to Product Hunt is meant to be a standalone company. PH overlaps with startup databases, but it’s also a place to discover fun and useful products.